Screener

#Last 7 Days
1
NVDA
NVIDIA Corporation - Common Stock
206.84 USD-0.92%+0.39%+7.11%+18.86%5.01 T USD
2
AAPL
Apple Inc. - Common Stock
333.02 USD+3.53%0.00%+21.10%+55.60%4.89 T USD
3
GOOGL
Alphabet Inc. - Class A Common Stock
319.74 USD+0.65%-8.94%-6.69%+65.10%3.91 T USD
4
MSFT
Microsoft Corporation - Common Stock
381.70 USD+0.03%-2.40%+6.88%-25.75%2.84 T USD
5
AMZN
Amazon.com, Inc. - Common Stock
232.11 USD-0.66%-6.69%+2.08%-0.57%2.50 T USD
6
TSM
Taiwan Semiconductor Manufacturing Company Ltd
403.63 USD-2.85%+1.36%-5.12%+66.12%2.09 T USD
7
AVGO
Broadcom Inc. - Common Stock
381.92 USD-2.69%+0.92%+3.22%+30.59%1.82 T USD
8
META
Meta Platforms, Inc. - Class A Common Stock
595.19 USD-1.80%-7.97%+9.61%-16.77%1.51 T USD
9
TSLA
Tesla, Inc. - Common Stock
313.03 USD-2.08%-18.92%-15.43%-1.63%1.24 T USD
10
LLY
Eli Lilly and Company Common Stock
1196.29 USD+0.91%+1.40%+5.79%+47.21%1.13 T USD

Heatmap

Charts & Ideas

DAX — week of July 27 – 31, 2026: Long
40
DE40 Long Germany 40 Index

DAX — week of July 27 – 31, 2026: Long

Long — Last week's map wanted 24,715 and the tape refused to pay it — the break off Wednesday's 25,370 died at 24,784, 69 points short, and Friday bought the whole thing back to a green 25,172 close. A market that won't do the easy thing is loading the hard one. This morning it gapped onto 25,370, last week's exact ceiling, held the retest 42 points above Friday's 25,228 high, and folded weekly R1 at 25,436 before lunch. Here is the mechanism behind the speed: resistance is inventory — prices where somebody owns something and defends it — and above 25,370 there is none. July 8 crossed the entire 25,000–25,660 corridor in one 703-point session on 34,226 lots, the heaviest day of the month, and in the thirteen sessions since, nothing above 25,370 has traded at all. That vacuum is why 300
0
stuki Istvan Balazsa 2026.07.27 13:20
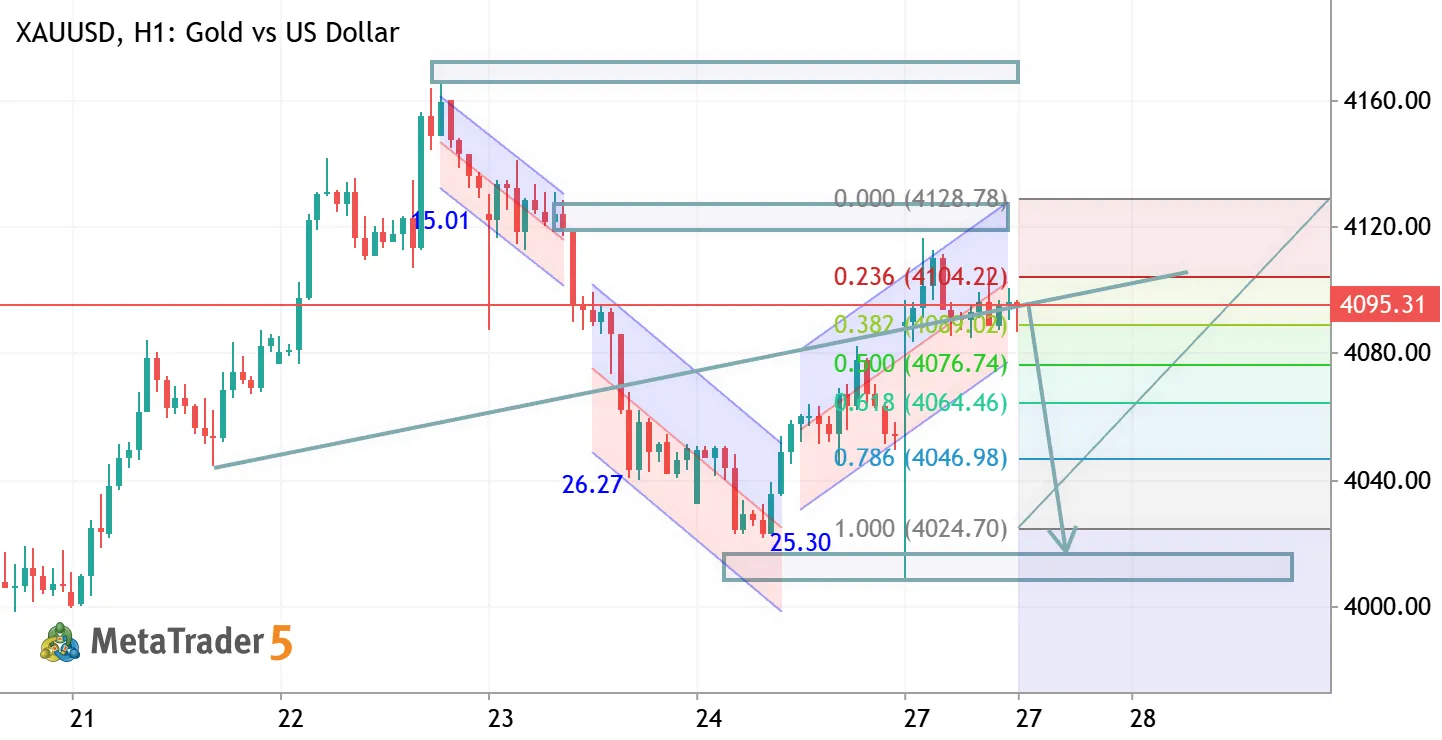
XAUUSD H1 ANALYSIS XAUUSD Gold vs US Dollar

XAUUSD H1 ANALYSIS

XAUUSD H1 Analysis Gold is attempting a bullish recovery after finding support near the recent swing low. Price is trading above key Fibonacci support, but buyers must clear the 4095–4130 resistance zone to confirm a trend reversal. A successful breakout could fuel further upside. 📈 Bias: Bullish Recovery 🎯 Targets: 4095 → 4130 ⚠️ Key Support: 4025–4000 Wait for a confirmed breakout or a pullback to support before entering. Always use proper risk management.
0
Goldanalysisteam Abdul Qayoom 2026.07.27 10:39
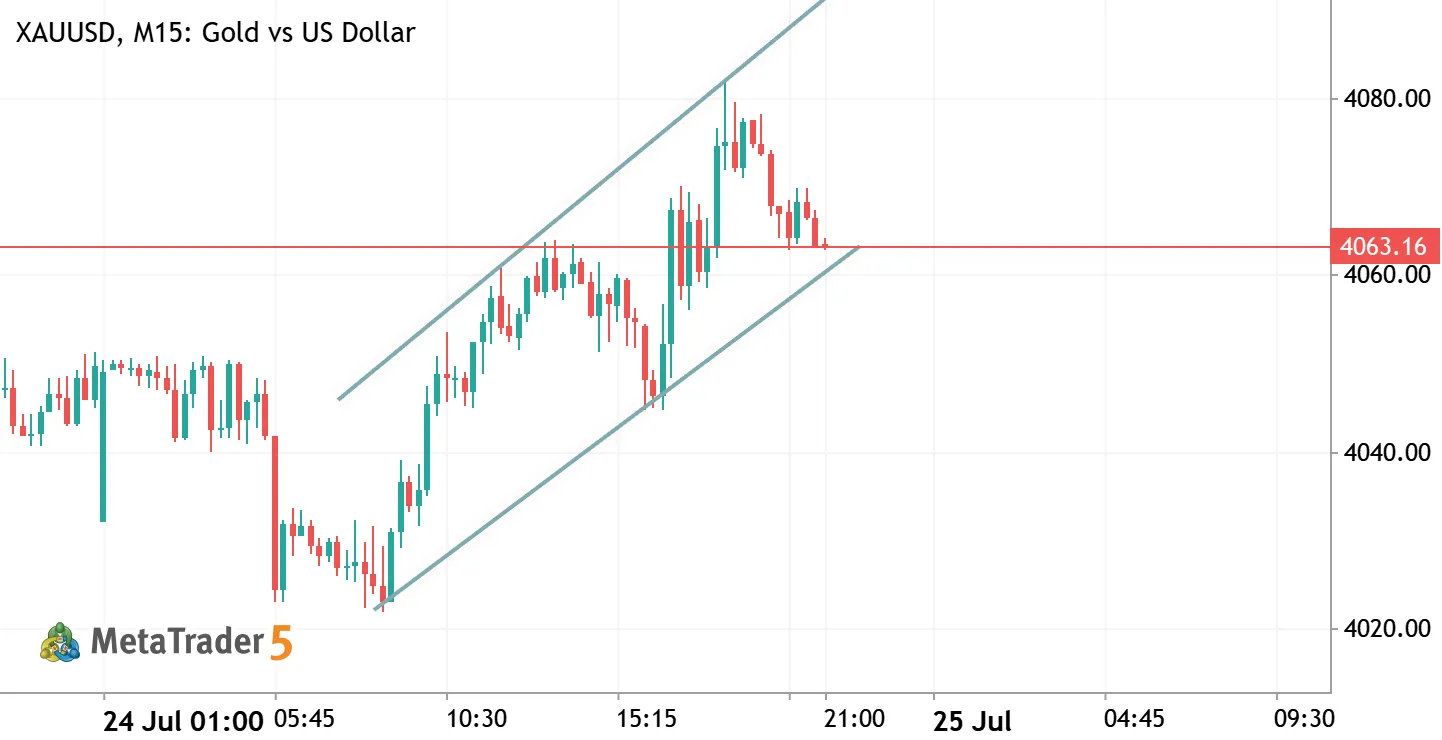
XAUUSD: Rising Channel Breakdown Potential Bearish Scenario XAUUSD Gold vs US Dollar

XAUUSD: Rising Channel Breakdown Potential Bearish Scenario

Gold is currently moving inside an ascending channel after a strong bearish move. However, this structure may represent a corrective pullback rather than a full reversal. I'm watching for a breakdown below the channel support. A confirmed break and rejection on the retest could indicate bearish continuation toward previous support areas. Key levels: 🔻 Channel support: Bearish breakout area 🔹 Support zones: 4050 / 4020 Waiting for price action confirmation before considering the next move.
0
therealjoe0621 Joel Wilbert Msigwa 2026.07.24 18:04
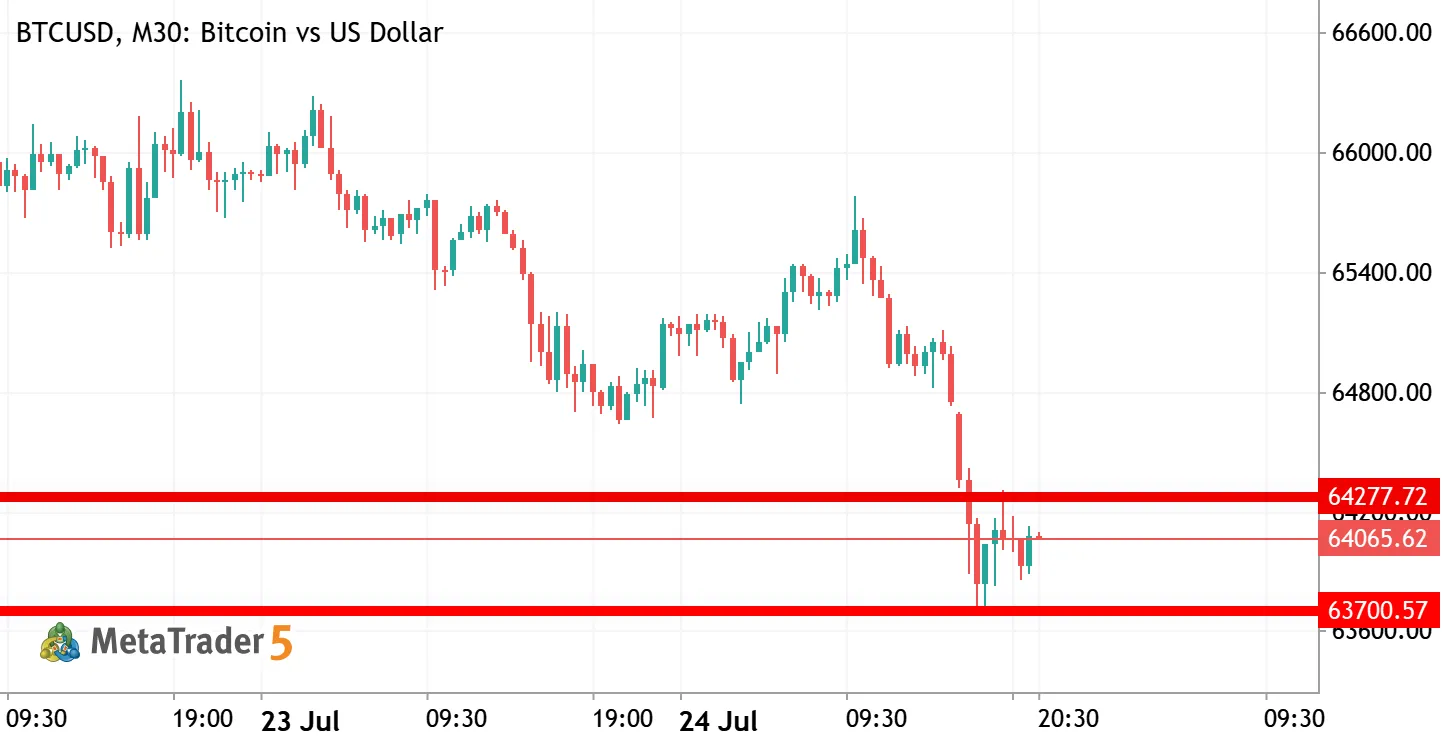
BTCUSD: Bearish Continuation Setup After Support Bounce BTCUSD Short Bitcoin vs US Dollar

BTCUSD: Bearish Continuation Setup After Support Bounce

📉 BTCUSD Market Structure Analysis Bitcoin recently bounced from the key support area around 63,700–64,000. However, price is now approaching a previous bullish reaction zone, which may act as resistance after the recent breakdown. I'm watching this area for a possible bearish rejection. If sellers regain control, BTC could continue its downside movement toward lower liquidity areas. Key levels: 🔴 Resistance / rejection zone: Previous bullish reaction area 🟢 Support: 63,700–64,000 Confirmation from price action will be important before considering the next move.
0
therealjoe0621 Joel Wilbert Msigwa 2026.07.24 17:33
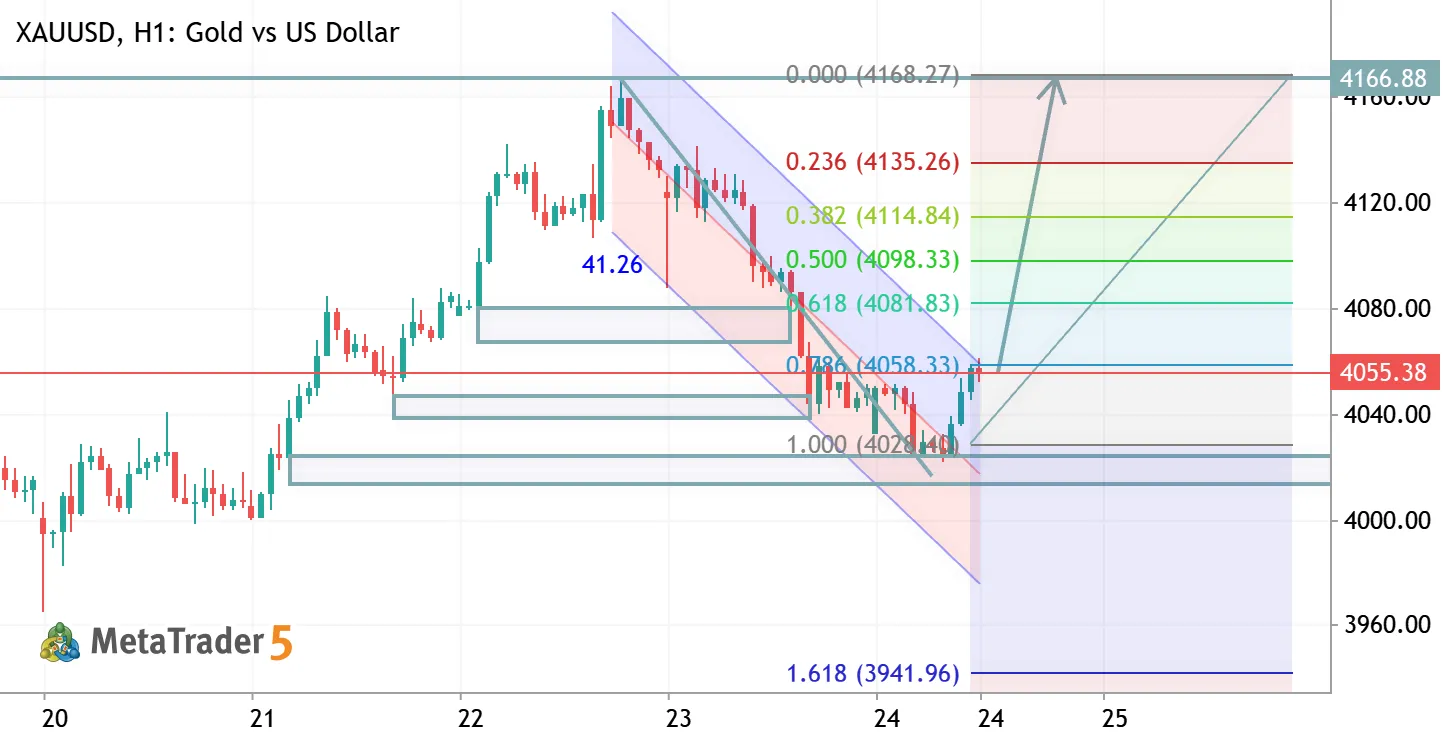
XAUUSD H1 ANALYSIS XAUUSD Gold vs US Dollar

XAUUSD H1 ANALYSIS

XAUUSD H1 Analysis Gold is showing signs of a bullish reversal after rejecting the descending channel support. Price has reclaimed key Fibonacci levels, and buyers are targeting the major resistance zone near 4165. A sustained move above resistance could accelerate the bullish momentum. 📈 Bias: Bullish 🎯 Targets: 4135 → 4165 ⚠️ Key Support: 4050–4020 The trend favors buyers while price holds above support. Wait for confirmation and apply proper risk management before entering.
0
Goldanalysisteam Abdul Qayoom 2026.07.24 09:47
BTCUSD TRADE IDEA BTCUSD Bitcoin vs US Dollar

BTCUSD TRADE IDEA

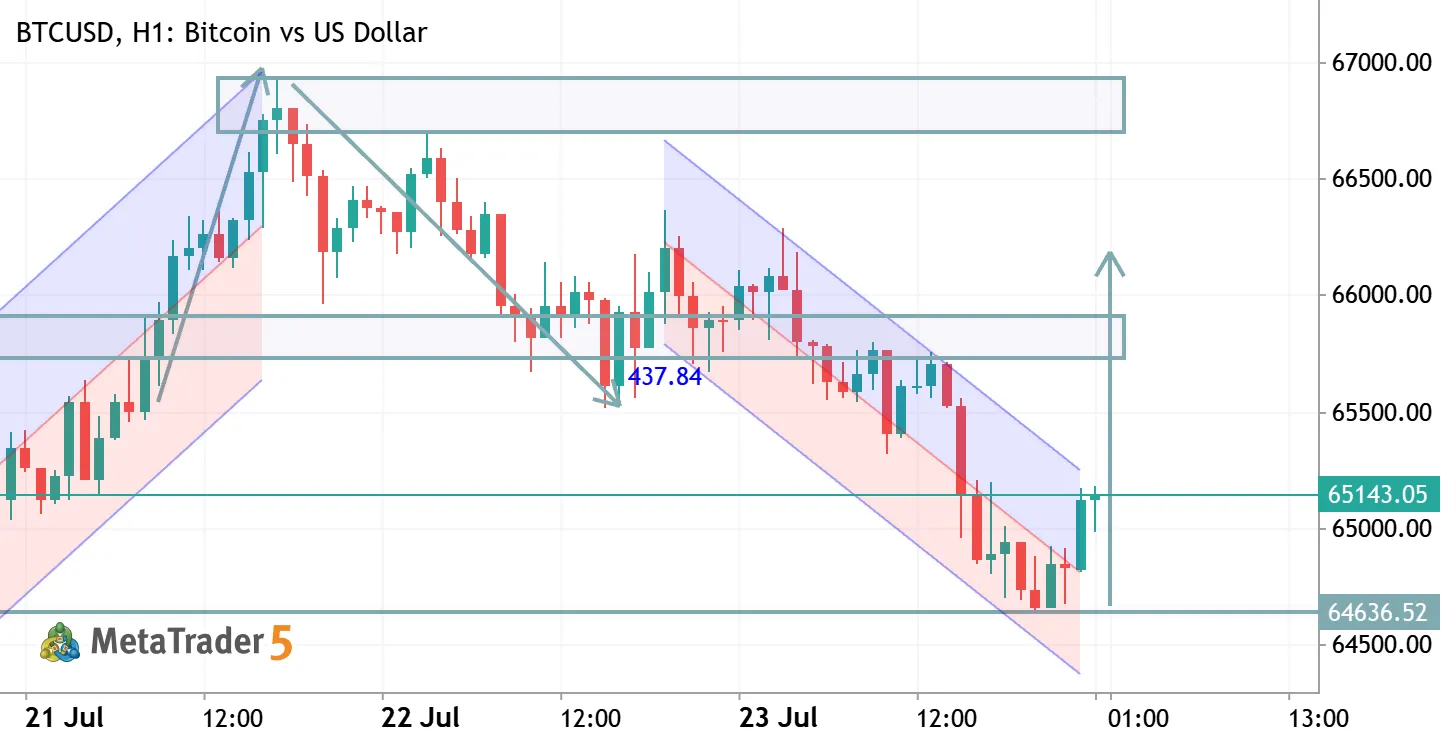
BTCUSD (H1) Bias: Buy Price has bounced from the lower boundary of the descending channel and is attempting a bullish breakout. A sustained close above 65,100–65,200 strengthens the bullish continuation. Buy Entry: 65,100–65,200 (or on a confirmed retest after breakout) Take Profit 1: 65,600 Take Profit 2: 66,000 Take Profit 3: 66,700 Stop Loss: Below 64,650 Summary: Momentum is turning bullish after rejecting channel support. A confirmed breakout above resistance favors further upside toward 65.6K–66.7K
0
HamadJatoi Hamad Jatoi 2026.07.23 22:08
XTIUSD - Daily Trading Forecast XTIUSD Long Crude Oil vs US Dollar

XTIUSD - Daily Trading Forecast

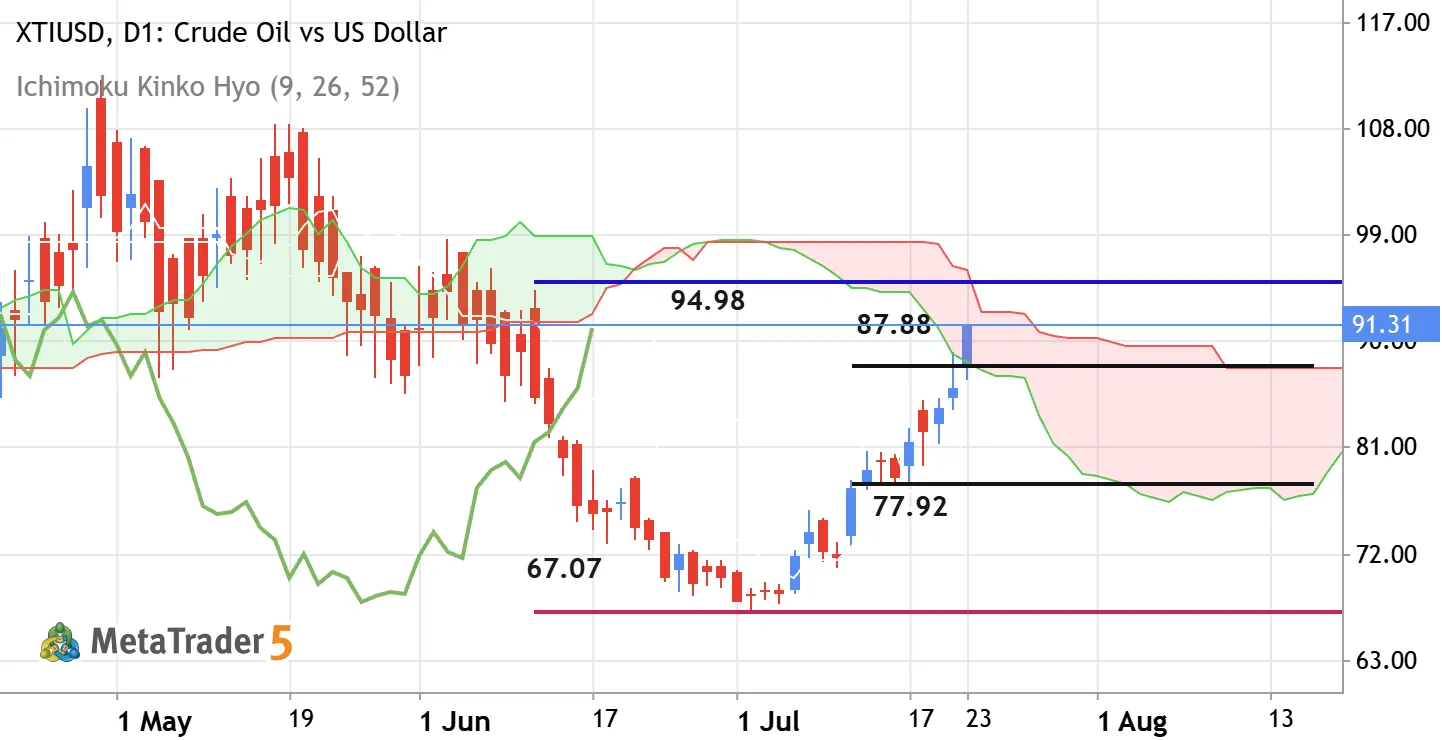
Daily price is breaking Ichimoku cloud together with the level at 87.88 to above for the primary bullish reversal. Stochastic oscillator is showing the uptrend in the near future, and Chinkou Span indicator broke the historical price for the good breakout to started. If the price breaks the level at 87.88 to above so the daily bullish reversal will be started with 94.98 level to re-enter. If the price crosses support level at 77.92 to below so the daily bearish trend will be resumed with 67.07 possible target for example. Alternatively, the price will be ranging near within s/r channel waiting for the direction of the strong trend to be started. Trading Summary : daily breakout with the possible daily bullish reversal
2
newdigital Sergey Golubev 2026.07.23 15:23
GBPUSD H4 ANALYSIS GBPUSD Pound Sterling vs US Dollar

GBPUSD H4 ANALYSIS

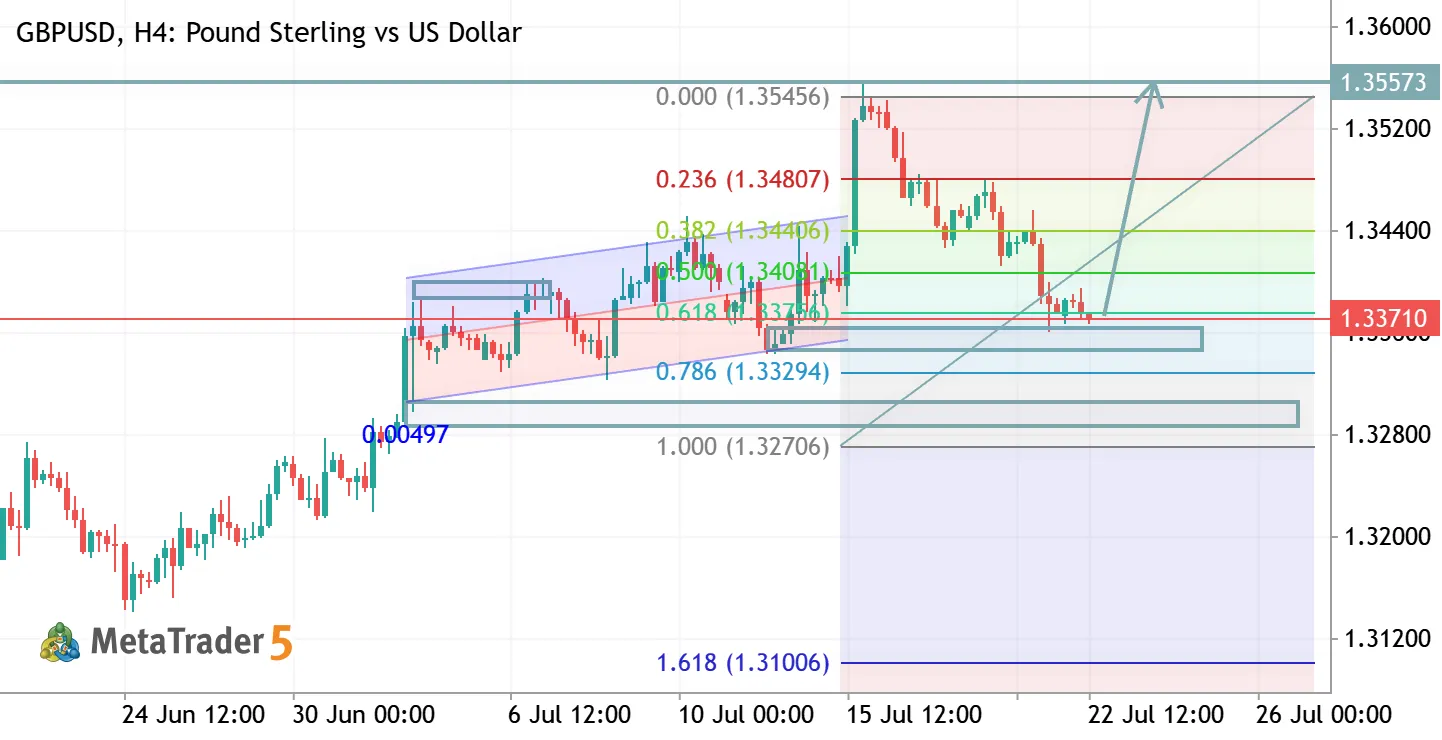
EURUSD Technical Analysis (H4) Price is showing a bullish structure after a strong recovery from the support zone. Buyers are defending the demand area, keeping the upside momentum active. 📈 Bullish scenario: A break above the recent resistance can open the way toward higher targets. 📉 Risk level: A drop below the support zone may invalidate the bullish setup. Key focus: Wait for confirmation at support/resistance levels before entry. #EURUSD #Forex #TechnicalAnalysis
0
Goldanalysisteam Abdul Qayoom 2026.07.22 09:47