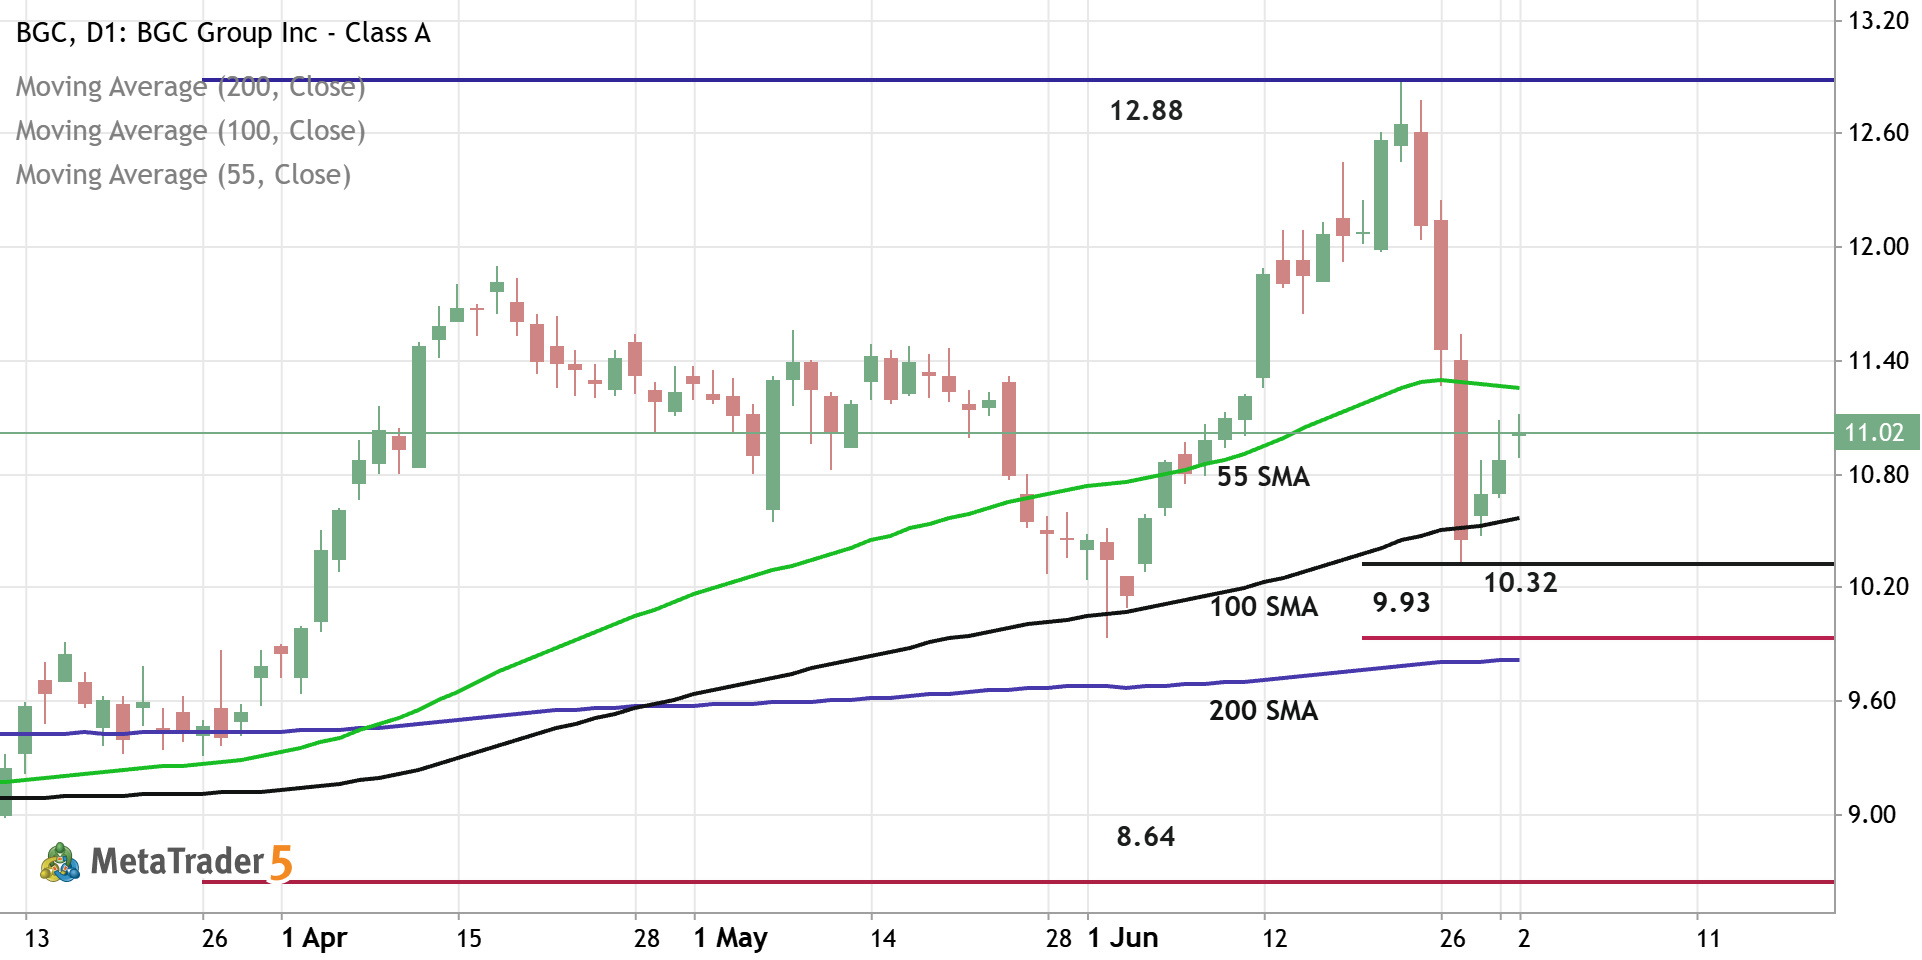
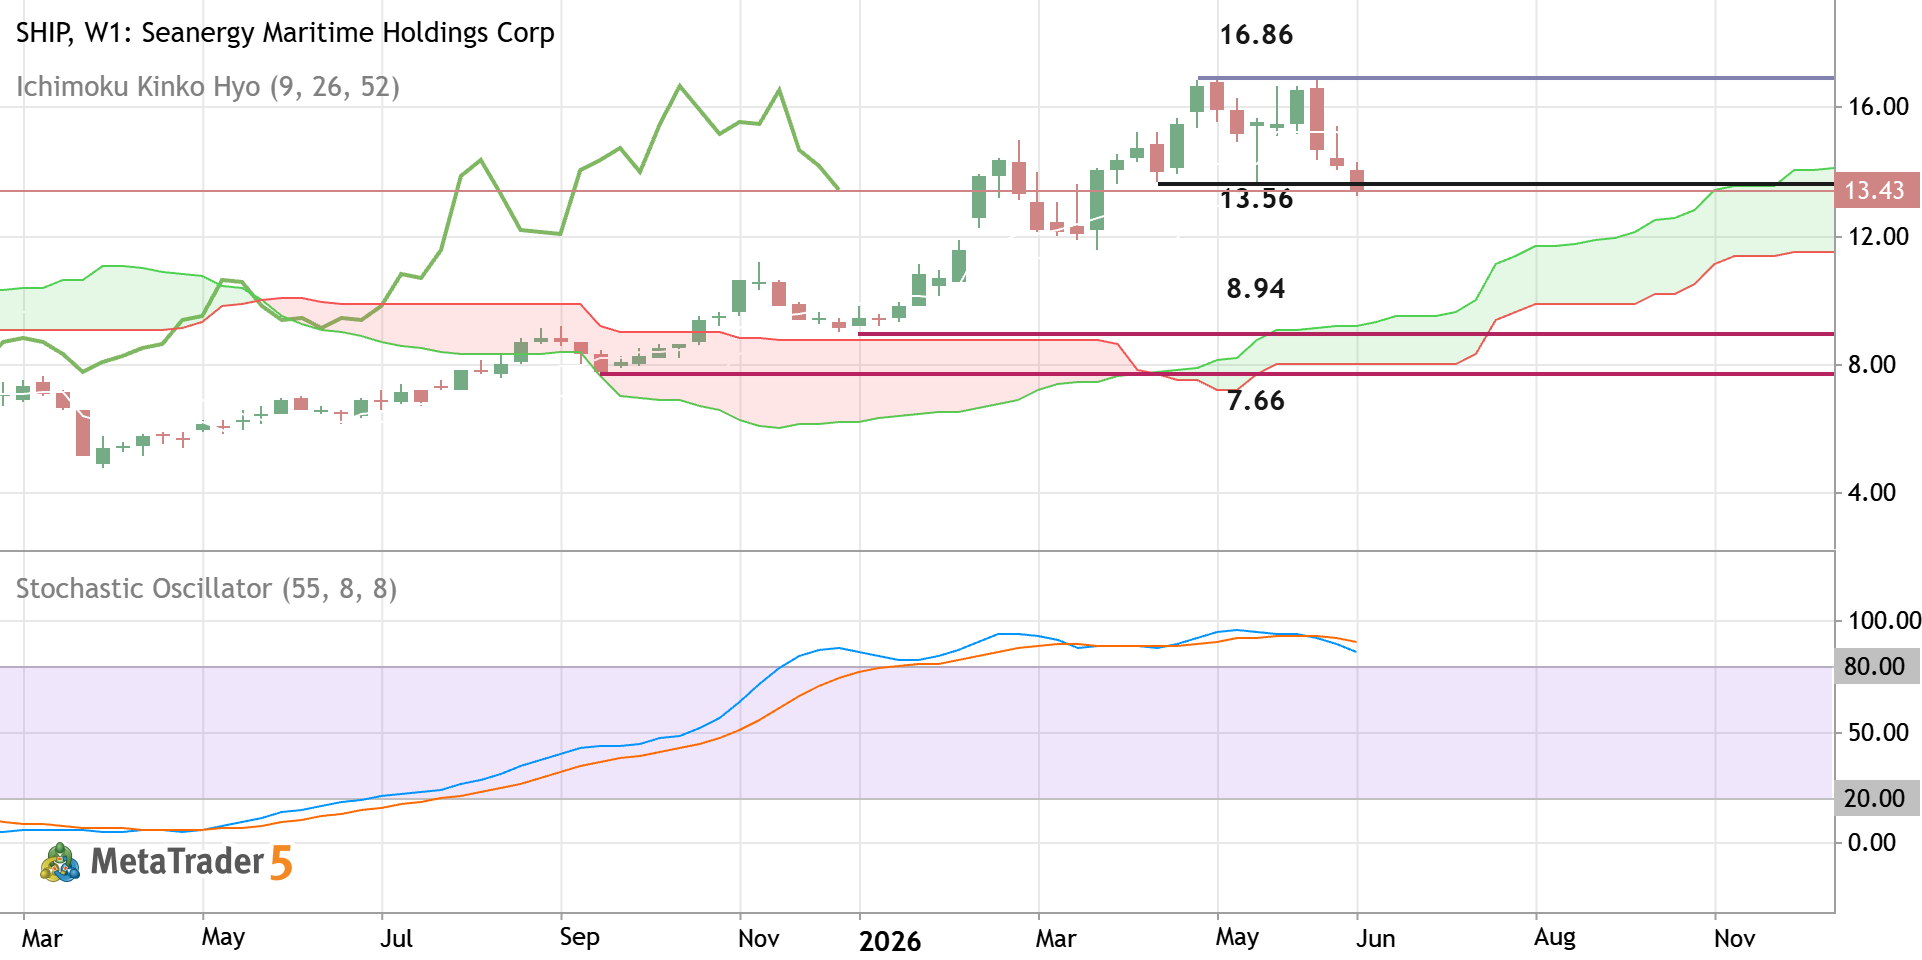
USDZAR - Price Action Daily Analysis USDZAR US Dollar vs Rand
USDZAR - Price Action Daily Analysis
Daily price is on ranging around 200 SMA within 16.66/17.22 s/r channel waiting for the direction, and the Stochastic oscillator is indicating the overbought market condition. If the price breaks support level at 16.66 to below so the primary daily bearish trend will be resumed. If the price crosses 17.22 resistance level to above so the primary daily bullish reversal will be started. Alternatively, the price will be on ranging waiting for direction of the strong trend to be started. Recommendation: waiting for direction 0
newdigital Sergey Golubev 2026.04.04 08:20
XAUUSD - Price Action Daily Analysis XAUUSD Gold vs US Dollar
XAUUSD - Price Action Daily Analysis
Daily price was bounced from 200 SMA together with support level at 4098 to above for the primary daily bullish trend be continuing, and stochastic oscillator is indicating the oversold market codition. Ascending triangle pattern was formed for the price, and for now, the price is testing 4787 resistance for the daily bullish continuation with 5419 possible target for example. If the price is reversed to be back to 4098 support by crossing it to below so the primary daily bearish reversal will be started. Alternatively, the price will be on secondary ranging within 4098/4787 s/r channel waiting for the direction of the bullish trend to be continuing or for the bearish reversal to be started. Summary: daily bullish trend to be continuing 0
newdigital Sergey Golubev 2026.04.04 08:02
XOM Technical Analysis 2026 XOM Exxon Mobil Corporation
XOM Technical Analysis 2026
The weekly price is on bullish breakout: price broke the resistance lines to above for the strong bullish trend, and Chinkou Span line of Ichimoku indicator rossed historical price to above for the good strong bullish breakout for now. But Stochastic oscillator is indicating the overbought condition for the weekly price now, and if the price breaks 162.3 support to below with 156.8 possible target to re-enter so the secondary correction within the primary bullish trend will be started; and if the price breaks support level at 145.0 to below with 134.1 target to re-enter so the primary bearish reversal will be started; alternatively - the price will be on secondary ranging for direction. 0
newdigital Sergey Golubev 2026.03.29 07:43
USDTHB Price Action Analysis: daily breakout with the bullish reversal USDTHB US Dollar vs Thai Baht
USDTHB Price Action Analysis: daily breakout with the bullish reversal
Daily price broke 200 SMA to above for the good daily breakout with the primary bullish reversal. The price is testing the resistance level at 32.93 to above for the daily bullish trend to be continuing. But the Stochastic Oscillator is indicating the overbought level for the price movement so the alternative way for the price movement is the secondary daily ranging within 32.07/32.93 s/r channel waiting for direction of the strong bullish trend to be continuing or the bearish reversal to be started. Trading Summary: waiting for direction. 0
newdigital Sergey Golubev 2026.03.21 15:49
Trading Ideas for 2026: USD/ZAR - Technical Forecast and Levels USDZAR US Dollar vs Rand
Trading Ideas for 2026: USD/ZAR - Technical Forecast and Levels
Weekly price is located below Ichimoku cloud in the bearish area of the chart. The price was bounced from support level at 15.63 to above for the bear market rally to be started for trying to break the resistance at 17.00 to above for the secondary rally to be continuing. Stochastic oscillator is indicating the oversold level of the price, and Chinkou Spam line of Ichimoku indicator is located to be near historical price from below to be ready to cross it to above for the good breakout to be started. If the price breaks 17.00 resistance to above on weekly close bar so the breakout may be started with the 17.57 bullish reversal target to re-enter, or the price will be on secondary ranging waiting for the direction of the good trend to e started. Trading Summary: future possible breakout with the bullish reversal, alternatively - ranging within s/r channel for direction. 0
newdigital Sergey Golubev 2026.03.21 15:30
Trading Ideas for 2026: SMCI - Technical Forecast and Levels SMCI Super Micro Computer, Inc. Common Stock
Trading Ideas for 2026: SMCI - Technical Forecast and Levels
Daily price broke 200 SMA to below for the primary weekly bearish reversal to be started. The price is located near and below 200 SMA trying to cross the support level at 27.21 to below for the primary bearish trend to be continuing. Alternatively, the price will be on ranging waiting for direction of the bearish trend to be continuing or for the bullish trend to be resumed. Recommendation: waiting for direction 0
newdigital Sergey Golubev 2026.03.14 11:58
Trading Ideas for 2026: PHO - Technical Forecast and Levels PHO Invesco Water Resources ETF
Trading Ideas for 2026: PHO - Technical Forecast and Levels
Chinkou Span line of Ichimoku indicator broke the historical price to below for the good breakdown to be started. The price broke the upper border of Ichimoku cloud to below together with support level at 69.00 for the breakdown with the primary weekly bearish reversal. The Stochastic oscillator is indicating the overbought level of the price to the bearish reversal to be continuing. If the price breaks 64.74 support level so we may see the weekly primary bearish reversal. Alternatively, the price will be on ranging waiting for direction. Trading Summary: breakdown with the bearish reversal 0
newdigital Sergey Golubev 2026.03.14 11:34
Trading Ideas for 2026: BABA - Technical Forecast and Levels BABA Alibaba Group Holding Limited American Depositary Shares, each represents eight Ordinary Shares
Trading Ideas for 2026: BABA - Technical Forecast and Levels
Weekly price is secondary correction to the primary bearish breakdown: the price is testing the upper border of Ichimoku cloud to below. Chinkou Span of Ichimoku indicator which is crossing the historical price for the good breakdown. Besides, the Stochastic oscillator is indicating the downtrend to be continuing. If the price breaks support level at 127,48 to below so the primary weekly bearish reversal will be started with the next support level at 103.63. If the price is bounced from support levels to above so we may see the bear market rally with 143.27 and 169.48 targets to re-enter. Alternatively, the price will be on ranging within the levels waiting for direction. Trading Summary: waiting for direction - watch for the weekly bearish reversal or for the secondary rally to be started. 0
newdigital Sergey Golubev 2026.03.12 14:43
Trading Ideas for 2026: USD/COP - Technical Forecast and Levels USDCOP US Dollar vs Colombian Peso
Trading Ideas for 2026: USD/COP - Technical Forecast and Levels
Weekly price broke Ichimoku cloud and it is located in the bearish area of the chart for now: Chinkou Span line of Ichimoku indicator broke historical price to below for the good weekly breakdown. But the Stochastic oscillator is showing the oversold market condition indicating the possible bear market rally in the future. Price is testing the support level at 3618 to below for the primary bearish trend to be continuing. Alternatively, the price may be bounced from support to above for the bear market rally to be started with the secondary ranging condition. Trading Summary: bearish breakdown; waiting for the bearish trend to be continuing or for the ranging with bear market rally to be started; possible bullish reversal in the long-term. 0
newdigital Sergey Golubev 2026.03.11 17:27