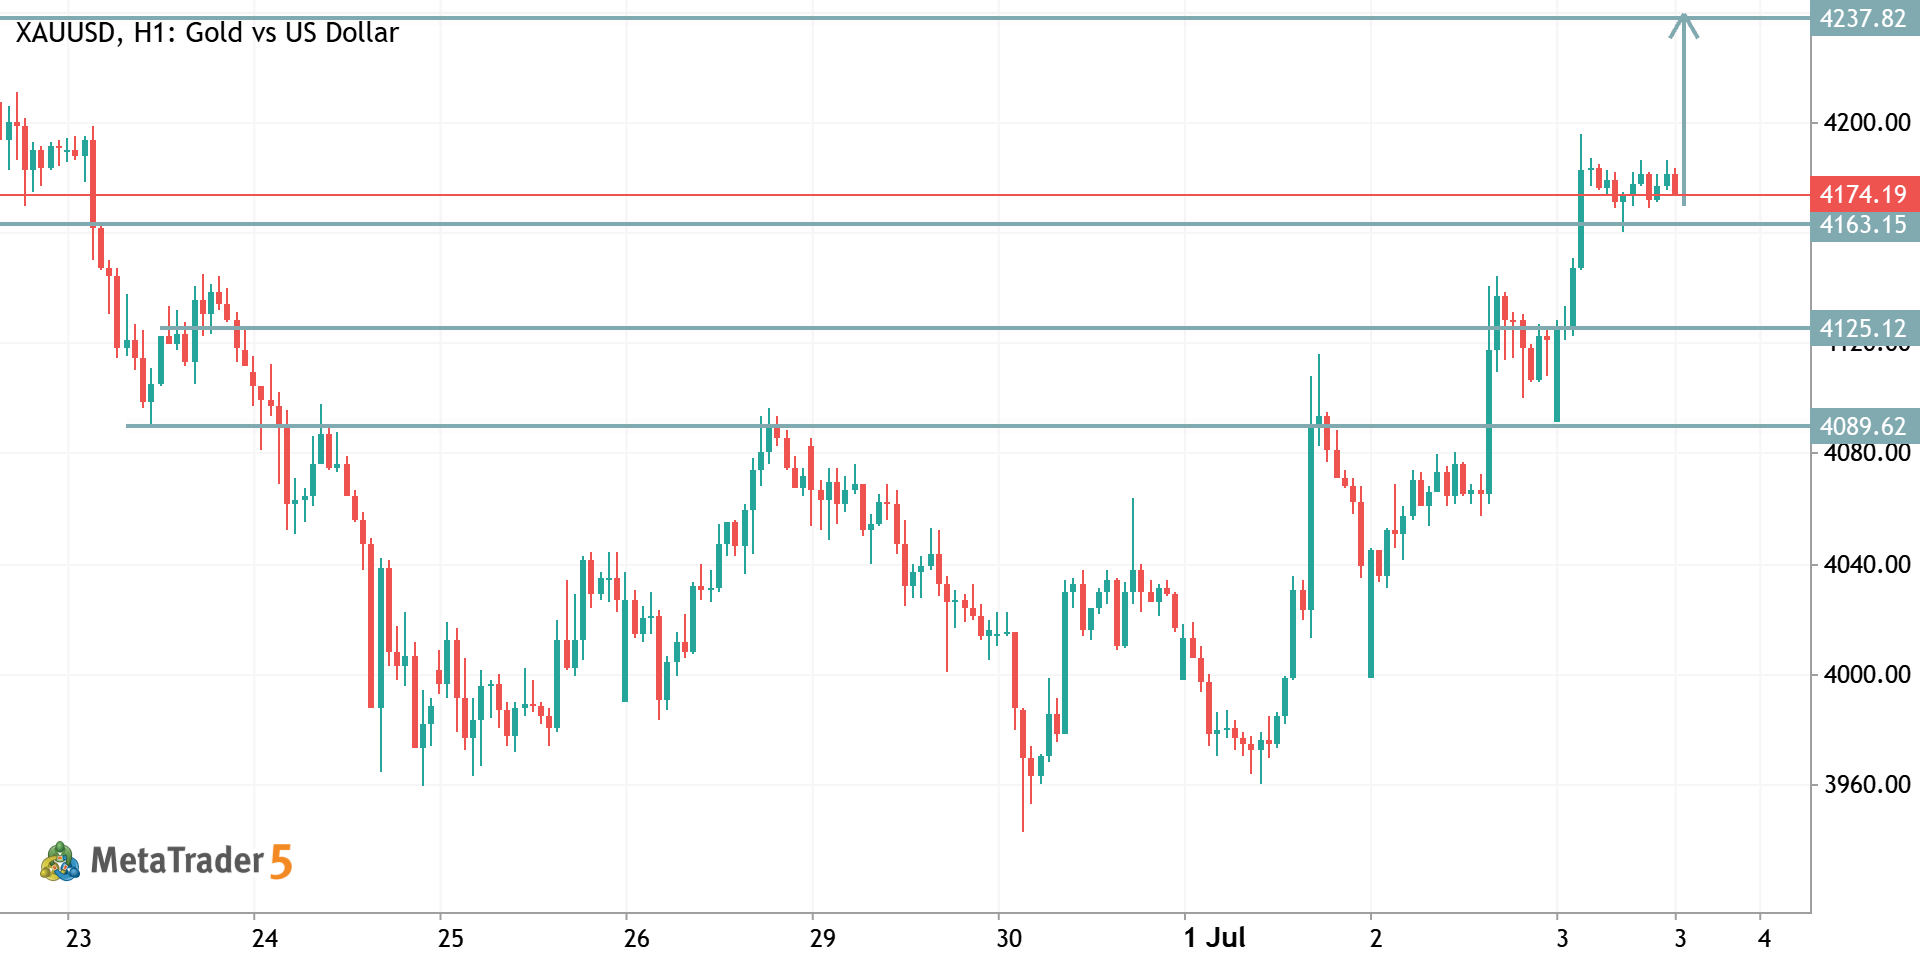
AAPL Short Trading Idea AAPL Apple Inc.
AAPL Short Trading Idea
A short trading idea for Apple Inc. is based on the stock approaching a strong resistance zone around $190–195, where price has repeatedly faced rejection. Technical indicators point to weakening momentum, with RSI in overbought territory and early signs of a potential double top or lower high structure forming. This suggests the upside may be limited in the short term and a pullback is increasingly likely 📊. The trade setup is to enter a short position in the $188–192 range, with a stop-loss placed above $197 to manage risk. Downside targets are set at $180 and $172, offering a favorable risk/reward ratio of around 1:2 or better. This structure provides a clear invalidation level and defined profit zones for disciplined execution 🎯. Trade Plan: 🔻 Entry: $188–192 🛑 Stop-loss: $197 🎯 Take-profit 1: $180 🎯 Take-profit 2: $172 On the fundamental side, bearish pressure may come from slowing iPhone demand, margin compression, and broader tech sector exhaustion. However, risks remain, including strong buyback 0
m Maxim Kruglov 2026.04.03 14:11
S&P 500 Drops 4.6% in Q1 — Can Markets Recover in Q2 Amid War and Rate Uncertainty?
500
US500 US SPX 500 Index
S&P 500 Drops 4.6% in Q1 — Can Markets Recover in Q2 Amid War and Rate Uncertainty?
📊 S&P 500 🔻4.6%, Nasdaq 🔻7.1%, Dow Jones 🔻3.6% January started on a strong and optimistic note. Economic growth was accelerating, the Federal Reserve appeared ready to continue cutting rates, and the AI boom still had plenty of runway. The mood across markets was genuinely positive. Then February 28 happened. The United States and Israel launched strikes on Iran — and just like that, sentiment collapsed. 📅 The Quarter That Wasn’t Q1 2026 turned into one of the most difficult quarters in recent years: S&P 500 fell 4.6% Nasdaq Composite dropped 7.1% Dow Jones Industrial Average declined 3.6% All three indexes recorded their worst quarterly performance in nearly four years. The Nasdaq officially entered correction territory on March 26, falling more than 10% from its recent peak — a level traders closely watch as confirmation that selling pressure is no longer temporary. The Dow followed a day later. Since the conflict began: Oil prices surged 63% Bond yields moved sharply higher The S&P 500 era 0
m Maxim Kruglov 2026.04.03 11:40
XRPUSD – When Trading Starts to Feel Like a Casino x XRPUSD Ripple vs US Dollar
XRPUSD – When Trading Starts to Feel Like a Casino
Looking at the current XRPUSD chart, the market structure is extremely noisy and driven by short-term speculation. Price is moving quickly between support and resistance zones without strong follow-through, which makes the environment feel less like structured trading and more like betting on short-term moves. Right now XRPUSD is hovering near the 0.64–0.66 resistance zone, where sellers previously stepped in. If the market fails to break this level, a pullback toward 0.60 and possibly 0.58 could develop. However, the way price behaves here shows how unpredictable the market can be. Honestly, sometimes publishing ideas on platforms like this can start to feel a bit like a casino or gaming environment, where everyone posts predictions and traders pick a direction hoping it works. Many ideas look confident, but in reality nobody knows the outcome. Without proper risk management, trading volatile assets like XRPUSD can easily turn into something that resembles betting rather than real strategy. 2026.03.11 13:25 0